The proliferation of Stuff models has invariably pitted capital-S Stuff against command in terms of their respective importance to a pitcher’s success. If you had to choose one, is it better to locate well, or is it better to be filthy?
The answer to this question is why baseball is beautiful and delightful but also occasionally horribly frustrating. From Vicente Iglesias and Scott Powers:
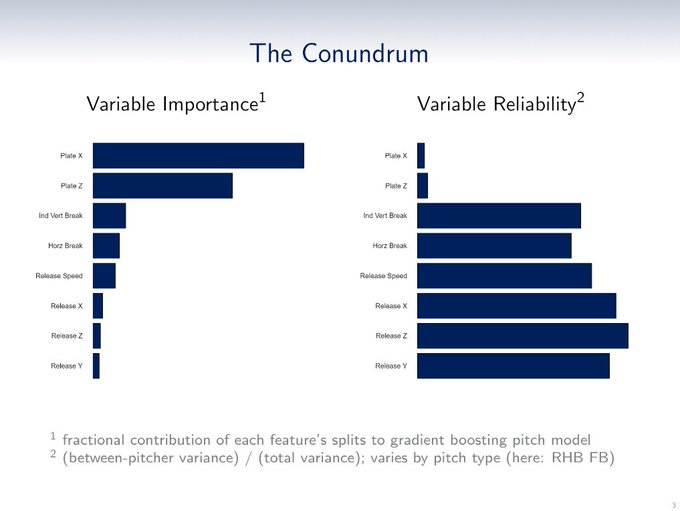
Importance, in layman’s terms, means how relevant a variable is to explaining an observed outcome; reliability is how much we can expect a variable to repeat or be repeated. In baseball, we often talk about these ideas in terms of “descriptiveness” and “predictiveness.” This dichotomy illustrates the Catch-22 that forever propels baseball forward in all its uncertain glory: pitch location plays an outsized role in determining the outcomes we witness, yet we cannot expect to rely on it year over year. Meanwhile, Stuff is much more reliable next year — i.e., changes to a pitcher’s pitches in terms of velocity, movement, and release point tend to vary to a much smaller degree over time — but it plays a significantly undersized role in influencing actual outcomes this year. Brutal stuff. Why do we even bother?
Part of this can be attributed to the volatile nature of the observed outcome itself. More than 700,000 pitches are thrown each year, yet only one-fourth of them terminate a plate appearance and thus record an official outcome. If a pitcher makes better pitches in the other three-fourths of his pitches but goofs up the ones that matter (from an on-field event standpoint), he’s out of luck. Furthermore, of the one-fourth of pitches that do successfully end a plate appearance, more than two-thirds of those are batted balls that are highly variable in their composition (i.e., exit velocity, launch angle, spray angle) and their value (e.g., single, double, triple, home run). Often, the composition of the batted ball is at odds with its value (i.e., expected versus actual wOBA).
This is kind of a long preamble simply to say: I’m not convinced pitch location is as unrepeatable as we make it out to be. Intuitively, I think most of us would believe this to be true. We rely on heat maps to see how pitchers locate their offerings; that they show any density, any “heat,” to begin with suggests an ability to repeat. It’s the overly granular nature of pitch location measurements that’s the problem: Statcast measures vertical and horizontal locations each to the nearest one-hundredth of a foot. To two decimal places! That’s delightfully precise for researchers but dreadfully precise for a pitcher being asked to repeat an assortment of very narrowly defined locations. Even rounded to the nearest inch, this is still too much to ask.
So maybe we need to ask less. Under the current framework, location is unrepeatable. And I’ll accept that to be true, because, by definition, it is. But command — which I will use today to describe an array of very precise locations that, when aggregated, culminate in a generalized set of targets or zones — is not unrepeatable. And while we can’t know a pitcher’s intended target, I think we can use a desired target as a proxy for that. (Just last week over at Baseball Prospectus, Stephen Brown used fancy modeling to infer intended targets for Blake Snell, our enigmatic, team-less Cy Young winner. Steve concluded the bad-walk-rate-but-good-command argument is partly cognitive dissonance: Snell indeed has below-average command, just like his double-digit walk rate suggests, and could afford to find the periphery of the zone a little more often. Despite Steve’s work, I will not be inferring intended targets — we’re sticking with desired targets today. Sorry, but I’m just not as smart as Steve.)
In Statcast data, MLBAM provides a field called “Delta Run Expectancy,” which is the change in run expectancy after each pitch. (I could do this myself, but I’m glad Statcast did it for me.) I calculated the average Delta Run Expectancy for every pitch location at (x, z) coordinates rounded to the nearest inch for all pitches that did not produce a batted ball event. For batted ball events, I calculated the average expected wOBA (xwOBA) on contact, also supplied by MLBAM. All of these calculations are performed within Statcast’s pitch type classifications, for better or worse, because not all pitch types play up (or down) in the same locations. These values are then weighted by the frequency with which a strike, ball, or batted ball event occurs at every (x, z) pitch location, providing an average run value per pitch. I’ll call this “Location Score.” Here’s Location Score by pitch location to the inch, where red is below 0 runs (good) and blue is above (normal to bad):

On average, run expectancy is above zero and, thus, blue. If it weren’t, we wouldn’t expect runs to be scored! So it’s much rarer to have a competitively commanded pitch that, on average, produces a Location Score below 0. (Please note that the graphic above flattens every pitch type’s “hot zone” into one; it’s purely for demonstrative purposes. Each pitch type’s unique “hot zone” would invariably look a little different.)
I made very deliberate choices with bubble sizing here. The larger bubbles represent the Statcast-defined “shadow” zone, while the tiny dots represent everything else. Within the shadow zone, I delineated the “inner” shadow (larger bubbles inside the zone) from the “outer” shadow (smaller bubbles outside the zone). You can see how well Location Score corresponds with commanding within the inner shadow. There are still pockets of inner shadow that don’t correspond well, namely at the middle of the east, west, and south edges of the zone. Removing these locations, it doesn’t leave a lot of daylight for commanding pitches truly well. But, by and large, it generally reconciles nicely with the inner shadow.
From here, I calculated a simple binary: Did the pitcher command his pitch in a hot zone (red, below zero) or a cold zone (blue, above zero)? A simple average of these zeroes and ones yields a percentage of pitches that a pitcher commanded competitively or (relatively) uncompetitively. (Ideally, this gels with PitcherList’s Mistake Rate metric — in fact, I may be re-creating the wheel with this whole endeavor — although I am loath to admit I did not overcome my laziness to actually investigate.)
For reference, the league-average rate of competitive pitches is 35.5%, which is honestly higher than I expected. Here’s a table of the top 15 pitchers who threw at least 1,500 pitches in 2023. Many of the names won’t surprise you in the slightest, and some definitely will. The second column is the pitcher’s rate of competitive pitches on the last pitch of a plate appearance, that particular and finicky subset of outcomes upon which a pitcher’s performance is actually evaluated on its face:
% Competitive Pitches Above Average
I won’t rattle off the names of the non-surprises. How about Hunter Brown, Yusei Kikuchi, and Nick Pivetta? Kutter Crawford, perchance? It’s really interesting (to me, at least) to see who excelled when it “mattered” (Joe Ryan, Justin Verlander, Gerrit Cole, Kevin Gausman) and who didn’t (Julio Urías, who notably struggled). We’ll get to the importance and reliability (a-ha!) of these measurements in relation to each other shortly.
But first, let’s get to the laggards. Here’s 2023’s bottom 16 (one bonus name, because it’s topical):
% Competitive Pitches Below Average
I think we can quickly identify an anecdotal argument that Location Score unduly punishes extreme sinker/changeup guys. They rely on pummeling the bottom of the zone, often below the bottom edge of the zone. That’s fine. I mean, it’s not fine, but I see it, and we’ll address it somehow, someway, someday. But for now, it is what it is. It’s important to remember, too, that this entire exercise is agnostic of Stuff — and guys like Framber Valdez, Logan Webb, and (even at his worst) Corbin Burnes have spectacular Stuff.
(My theory for why this is, by the way, is Statcast’s xwOBA is very much batter-centric, such that it emphasizes exit velocity much more than launch angle. However, pitchers have much more control over launch angles than exit velocities. The solution, then, would be to concoct an alternative pitcher-centric xwOBA and insert it into this analysis. I think it would resolve this issue with heavy sinker/changeup guys in particular, and inevitably other unseen contact management issues, too.)
I’m not here to diagnose each pitcher’s Location Score plus-or-minus average; I’m just here to test reliability. So! The big question! Is command, by virtue of Location Score, reliable — that is, is it repeatable year over year? You bet your sweet cheeks it is, pal. Here are the percentages of competitive pitches in 2022 (x-axis) and 2023 (y-axis) for all pitchers who threw at least 500 pitches in each season (n = 397):

An r-squared of 0.43! That’s very solid. Furthermore, the within-year relationship for 2023 (n = 276 pitchers, min. 500 total pitches) between intermediate (non-PA-ending) and final (PA-ending) competitive pitches is similarly strong (r-squared = 0.47)…

… which is strong enough for me to assume, perhaps mistakenly, that big differences between a pitcher’s competitive pitch rate to end plate appearances ought to regress toward his average competitive pitch rate for all pitches. It’s possible some pitchers don’t do this, that some — like Verlander and Cole among the game’s perennial elite, or, at the other end, Cal Quantrill — consistently command their pitches better or worse in higher-leverage counts. I totally believe that. But, by and large, I would expect most pitchers don’t, or can’t.
And that’s all I’m here to say. Location is not repeatable, but I think command (as I’ve defined it here) is.
It’s important to acknowledge that differences in command-related skills amount to only a few percentage points above or below average among all pitches thrown. It’s really not a lot — although, over the course of a single game, Ryan making seven extra locationally competitive pitches than the average pitcher is not something to sneeze at. It’s just that, of those competitive pitches, what happens to them? Are they intermediate or final pitches? When they end a PA, do they allow a batted ball? What does that batted ball look like? Was Ryan “lucky”? “Unlucky”? There’s just a lot of variables — and, thus, a lot of variance — to confront.
That’s neither here nor there for now. I just wanted to make a case for command as not only a skill that a pitcher owns but also a skill that can be relied upon year over year. To be clear, I’m not saying anyone doubted this. I don’t want to make it seem like there was some consensus about command being, like, not real. I do think, though, that its importance got lost in translation with the popularization of Stuff models that emphasize pitch shape over pitch location — and that accompanying pitch location models, with the hyper-specificity of pitch location coordinates, may lose sight of the forest for the trees. Allowing pitchers the grace of a broadly defined desired (or, if available, intended) target helps resolve that.
So: If you could choose one, is it better to locate well or simply be filthy? The truth is, you don’t have to choose. You can probably have both — reliably.
